The proposal to cash dashboard that explains what to fix
3 min read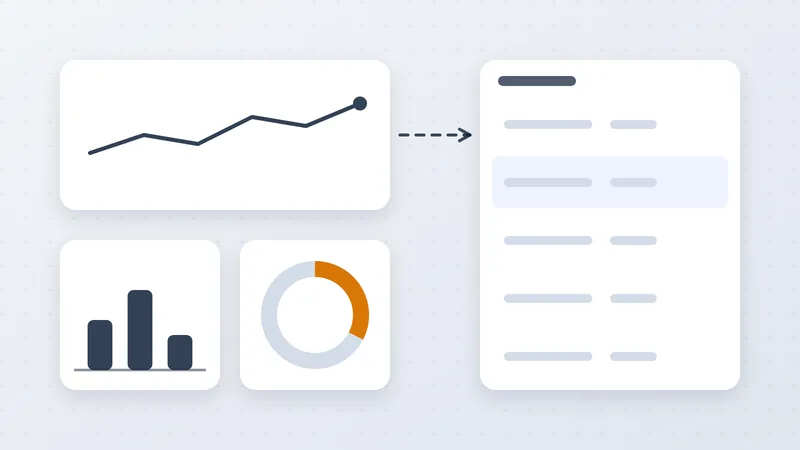
A dashboard can display revenue, invoices and payments while leaving the owner unable to answer a basic question: which delay should we fix first? Useful measures identify a stage, an accountable owner and a decision. They also reconcile to records the business trusts.
Xero's April 2026 US release reported average time to payment of 28.8 days and average lateness of 9.0 days for the March quarter.[1] These are different measures. The same distinction should appear in an internal dashboard: a customer taking 30 days to pay is not necessarily 30 days overdue.
Define the measures before drawing the charts
Track eligible-to-invoiced days from the contractual billing event to invoice release. Show eligible but uninvoiced value and its age. Track first-pass invoice acceptance using known acceptance outcomes, with pending confirmations visible. Show overdue value by due-date aging bucket, open dispute value and age, and unidentified receipts awaiting allocation.
For each measure, document the date field, amount basis, exclusions, reporting entity, currency, refresh time and owner. Decide whether taxes are included and apply that decision consistently. A chart is not comparable month to month if its denominator or cut-off changes silently.
The invoice readiness article explains acceptance, and the cash allocation guide explains why an outstanding invoice balance can be wrong even after money has arrived.
Use DSO as a signal with context
One common internal DSO convention is closing trade receivables divided by credit sales for the period, multiplied by the number of days in the period. Other conventions use average receivables or different windows. Select one, label it and avoid mixing definitions when comparing results.
An illustrative firm with $200,000 of receivables and $100,000 of credit sales during a 30-day month reports 60 days under the closing-balance convention. If sales temporarily fall to $80,000 with the same receivables, the result becomes 75 days even though no individual invoice has aged an extra 15 days. That is why DSO needs supporting invoice-level analysis.
Segment by billing model or customer group when their terms differ materially. A shift toward customers on longer agreed terms should not be described as a deterioration in collections without examining lateness against those terms.
Give every red number a drill-down
If disputed balances increase, show the cases, reasons and owners. If billing delay rises, show eligible events waiting for approval or invoice creation. If a sync is stale, mark affected figures as stale instead of presenting false precision.
A weekly operating review can focus on the largest actionable blockers and overdue internal tasks. A monthly management review can examine recurring causes, labor effort and whether the business case is being realized. These meetings have different purposes and do not need identical dashboards.
Avoid attractive totals that mislead
Invoice value is not automatically recognized revenue. Payment activity is not always settled cash. A reduction in overdue balances may include credits or write-offs. A consolidated figure may double count an intercompany transaction or combine currencies without a defined conversion policy.
Show collections, adjustments and remaining balances separately. Pair averages with an exception list or a high-percentile view so a few severe delays do not disappear inside an improving mean. The final test is practical: after reading the dashboard, can the team name the next action, the responsible person and the evidence needed to close the issue?
Sources
- Xero. New Xero Data Shows US Small Businesses Face Mounting Pressure as Payment Delays Rise and Cost Shocks Loom (opens in a new tab). 30 April 2026. Vendor data release.↩